FECT — Funk Engineering Control TowerLet's talk
REAL-TIME OPERATIONAL INTELLIGENCE

Every Second Counts.

Because every second costs.

FECT connects operational data across people, processes, machines, and systems—then alerts managers where to act in real time.

YOUR OPERATION. IN REAL TIME.INTERACTIVE DEMO
◔
SLA ON TRACK98.6%

Orders within SLA

On track
LABOR UTILIZATION

78% productive 14% inactivity 8% dead time

TODAY’S TOTAL PERFORMANCE97%

Actual vs target · Today

Loading the connected operation
PEOPLE, MACHINES & WORK IN MOTION Drag to rotate · Scroll while focused to zoom
↥
SHIPMENT / CURRENT OPERATIONCollecting pallet
ONE SHIPMENT. THE COMPLETE JOURNEY. PLT–2048 / 45-second demo
A truck arrives at inbound dock 01.00:00 / 00:45
BUILT FOR FULFILLMENT, LOGISTICS & MANUFACTURINGIllustrative 3D simulation and sample metrics. Not live asset-location tracking.
THE COST OF LOST TIME

You pay for eight hours.
Where does every minute go?

FECT separates productive work, inactivity, necessary indirect work, and dead time—then puts a labor cost on every part of the paid shift.

ONE PAID SHIFT, FULLY EXPLAINED8h shift · 1 employee · $22/hour
PER-SHIFT COST VIEW
ActivityShareTimeCost / shift
Productive work76%6h 4m 48s$133.76
Inactivity14%1h 7m 12s$24.64
Indirect work3%14m 24s$5.28
Dead time7%33m 36s$12.32
A typical pattern FECT identifies when analyzing client operations.Nearly every company experiences some level of paid-time leakage.
ESTIMATED WASTED-TIME COST$42.24/ employee / dayESTIMATED WASTED-TIME COST$10,560/ employee / yearESTIMATED WASTED-TIME COST$2.112M/ year / 200 employees
FECT can reduce wasted time by 58% MODELED: 24% BASELINE → 10% FECT TARGET

Calculated from inactivity, indirect time, and dead time only · $22/hour · 250 workdays/year.

01

Find hidden labor loss

See where paid time disappears across every shift.

02

Act before the shift ends

Push the critical alert to the manager in real time.

03

Prove the financial impact

Put time and cost on every operational gap.

THE NUMBERS BEHIND LOST TIME

What could this mean for a 200-person operation?

FROM SIGNAL TO ACTION

Know before
it becomes a problem.

The right alert. To the right manager. At the right time. Spot dead time and performance drops while there is still time to act.

REAL-TIME OPERATIONAL ALERTS

A signal you can
act on. Immediately.

Know when dead time rises, performance drops or people need support. Give the responsible manager the context to act.

01 Detect the gap02 Notify the right person03 Protect the shift
Faster reactions. Higher performance. Lower risk.
9:41
Monday, 12 May
Dead time exceeded 8%Picking · Line 3
now
David N. below 80% of targetPicking · Performance alert
5 min ago
3 people on dead timeOpen the shift details
12 min ago
FECT KIOSK

Make invisible work measurable.

Workers use a standard tablet or computer with a camera to clock in and record cleaning, replenishment, maintenance, meetings, and other work outside WMS/ERP—without extra cards, PINs, or scanners.
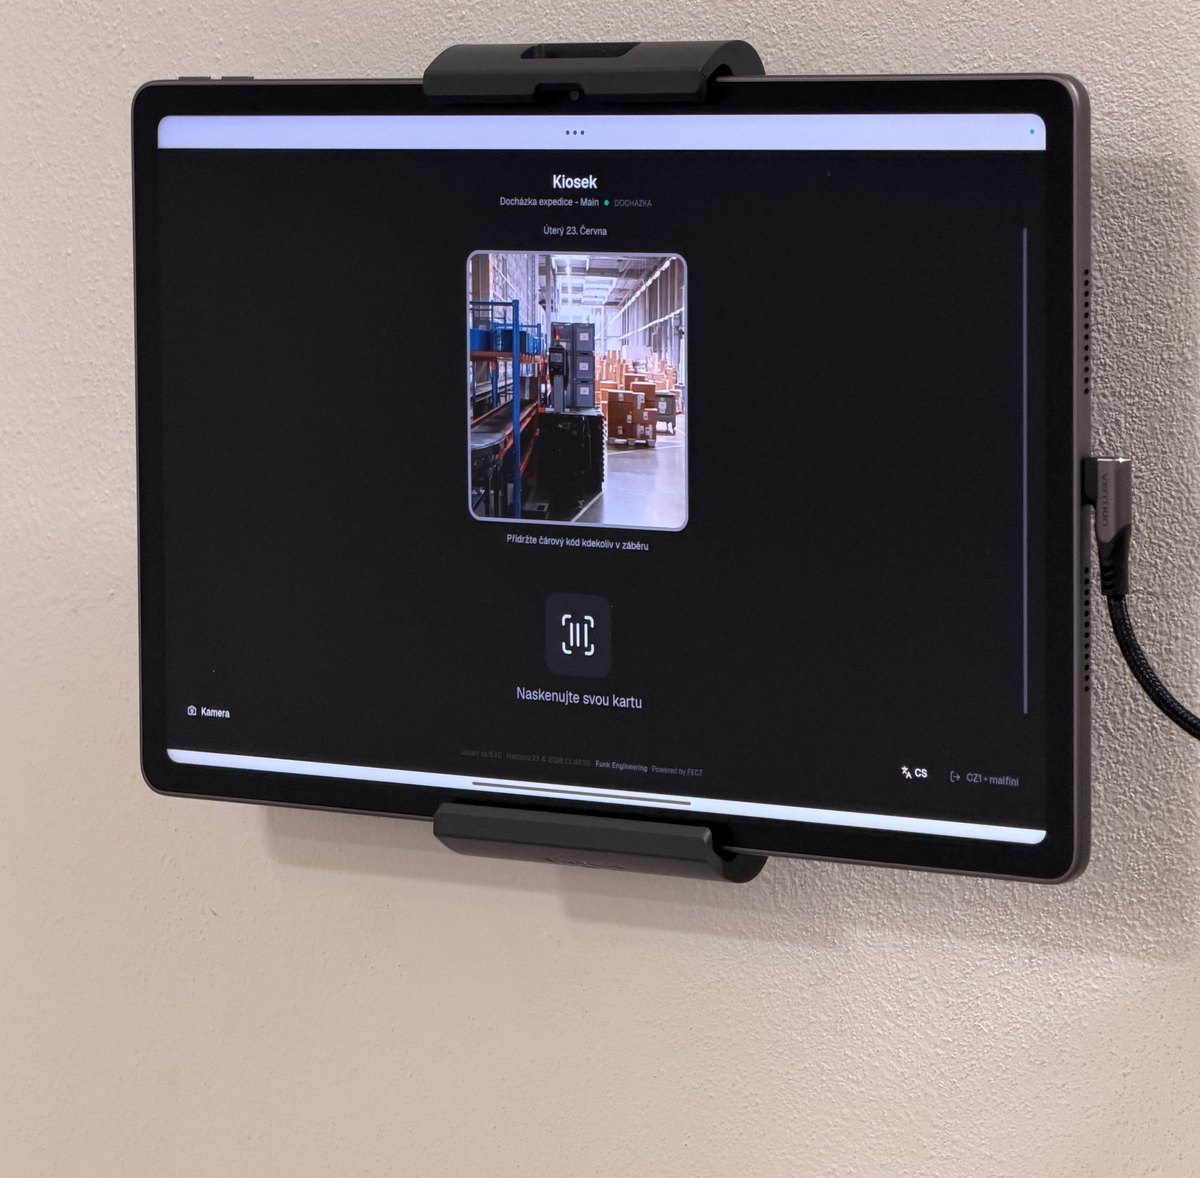
Floor activity→Complete shift data
FECT Kiosk running on a standard wall-mounted tablet
LIVE INPUT Standard hardware. Work recorded where it happens.
ONE CONNECTED OPERATION

Connect the data.
Take action.

Bring together WMS, ERP, attendance, internal systems and automation. FECT turns these signals into operational decision support.

YOUR EXISTING SYSTEMS
WMS
ERP
Time & Attendance
Internal Systems
Robots & Hardware
ONE INTELLIGENCE LAYERFECTReal-time operational
decision support
Connect. Understand. Act.
DECISIONS YOU CAN ACT ON
SLA Management
Performance & KPI Tracking
Skill-Based Moves
Cost Tracking
Capacity & Forecast
Recommended Actions

Your WMS executes the work. FECT helps decide what to do next.

01Right people. Right place. Right time.Balance workload with skills, capacity and recent performance.Learn more

Recommend the next move. Your team leaders decide and execute.

Compare current and recommended staffing. In the example, two qualified operators move from receiving to packing to balance workload and help protect SLA.

Staffing overviewOperators · next 2 hours · illustrative
CurrentRecommended
02Beyond people. Every asset matters.Measure technology with the same clarity as your people.Learn more

One view of people and equipment.

Track downtime, dwell time, productive time and utilization across AMRs, AGVs, conveyors, packing stations and other equipment.

Technology & automation performanceIllustrative operating snapshot
Downtime2.8%
Dwell time16 min
Time between activities
Productive time72.4%
Utilization81.6%
AMR / AGVConveyorsPacking stationsOther equipment
03Performance review & rewards.Turn daily evidence into coaching, goals and fair recognition.Learn more

Make progress visible, week after week.

Use transparent scorecards, regular reviews and a skill matrix to support feedback, coaching and performance-based rewards.

Weekly reviewsPerformance bonusesTransparent scorecardsIndividual goalsOngoing feedbackEvolving targetsCoachingSkill matrix
Daily performance reviewIllustrative
Metric / processTue, Oct 20Mon, Oct 19
Daily savingsEstimated capacity value$1,180$940
Productive timeTarget ≥ 75%81.8%79.3%
Dead timeTarget ≤ 8%1.5%2.7%
InactivityTarget ≤ 10%9.1%11.5%
PickingTarget ≥ 100%89.6%91.9%
PackingTarget ≥ 100%118.2%134.4%
HOW IT WORKS

Four steps, and only the first one needs your IT team.

Keep the systems you already use. FECT adds the live intelligence layer above them.

STEP 01

Connect

Read-only access to WMS, ERP, attendance, and automation data. Nothing is replaced or written back.

STEP 02

Measure

Measure live performance across people, machines, automation, and processes—including work existing systems miss.

STEP 03

Detect

Compare actual performance with targets and history, then flag the gap while managers can still change the shift outcome.

STEP 04

Alert

The manager gets the problem, its cost, and the next action directly on the phone.

CONNECTED IN WEEKS, NOT QUARTERS

Start with one site, validate the opportunity, then scale.

ONE LIVE SOURCE OF TRUTH

Four people. Four different questions.
One set of numbers.

SITE DIRECTOR

What is today costing us?

OPERATIONS MANAGER

Where should we move people?

TEAM LEADER

Who needs help right now?

CONTINUOUS IMPROVEMENT

Why does this keep happening?

WHO BUILT IT

People who ran the floor before they wrote the software.

FECT comes out of Funk Engineering and the Norwegian and Swiss teams we have worked alongside for years. Together, we bring hands-on experience from site launches, process redesign, labor planning, and automation projects across Europe and North America. Every screen in FECT exists because somebody needed it during a bad shift.

15+ yearsOperational and engineering work in live facilities
6 countriesProjects delivered across Europe and North America
WeeksTypical time from first connection to a working board
THE PEOPLE BEHIND FECT

Operational experience. A dedicated team.

Tomas

Tomas

Founder

Kate

Kate

Co-founder · HR & Performance

Lukas

Lukas

CI & Client Performance Manager

Sarka

Sarka

Customer Experience & Onboarding

Patrik

Patrik

R&D

Tomas

Tomas

R&D

SEE FECT IN ACTION

Find the time your reports cannot explain.

Bring one operational challenge. We will show how FECT detects the loss and builds the business case from your own data.

Tailored to your operation. No public pricing.
02 / MEET YOUR CONTROL TOWER

From the floor.
To the full picture.

See FECT in action.
The platform behind better operational decisions.

Original product video from fect.app · Open video

ILLUSTRATIVE ECONOMIC VALUE

The numbers for a 200-person operation

A conservative model based on operational patterns typically validated after FECT deployment.

TYPICAL MODEL CASE

200-person operation

A simplified example based on operational patterns typically validated during FECT deployments.

200employees
$22average hourly labor cost
8 hourspaid shift
250operating days / year
ANNUAL PAID LABOR COST$8.8M

Paid labor is often the largest addressable operational cost.

Identified wasted time24% of paid labor$2.112M
Modeled FECT wasted-time target10% of paid labor$880K
Modeled wasted-time cost reduction58.33% of identified waste$1.232M
Productivity increase+15%Capacity gain
Labor planning−2%$176K
Overtime−1%$88K
MODELED WASTED-TIME COST REDUCTION$1.232M

24% baseline → 10% modeled target · 58.33% reduction

Identified wasted-time baseline$2.112M / year
Modeled target wasted-time cost$880K / year
Productivity opportunity+15% capacity
Modeling wasted time from 24% down to a 10% FECT target recovers 14 percentage points, equal to a 58.33% reduction in wasted-time cost.Productivity, labor planning, and overtime are additional overlapping opportunities. Together, validated FECT levers can reduce total labor costs by up to 15–20%; the rows are not additive.
UP TO 15–20% TOTAL LABOR COST REDUCTIONValidated from each operation's data

Illustrative model only—not a guarantee or financial forecast. Your opportunity is calculated and validated from your own operational data after deployment.

MALFINI — Results after 3 months

MALFINI / RESULTS AFTER 3 MONTHS

Even great operations have hidden capacity.

Even a highly automated operation that looks excellent at first glance can hold significant opportunities. After three months of FECT deployment at MALFINI, lower dead time was one of the improvements uncovered and addressed.

Dead time26.9% → 7.4%
Fast start14.0 → 5.2 min
Strong finish19.5 → 1.7 min
Dead time: before vs. month 3Share of tracked paid time
Before
26.9%
Month 3
7.4%
ESTIMATED RECOVERED CAPACITY / MONTH3,297 hoursCZK 989,148
BEYOND DEAD TIME

One result. A wider operational change.

FECT also helped establish the visibility and daily management practices behind better decisions.

  • Data visibilityA clear view of what is happening across the operation.
  • Warehouse process performancePerformance tracking across warehouse processes.
  • KPIs & daily goalsClear targets that turn performance data into daily priorities.
  • Data-based employee rewardsEmployee rewards informed by FECT performance data.
  • Labor managementBetter visibility of workload, staffing and available capacity.

Results reported after three months of FECT deployment. Monthly recovered capacity and its value are estimates.

SCHEDULE A DEMO

See the value above your own operational stack

Tell us the one operational challenge you want to solve. We will tailor the demonstration to your systems, data, and savings opportunity.

TAILORED PROPOSAL

Request pricing for your operation

FECT pricing is based on the size, complexity, number of sites, integrations, and selected capabilities of your operation. No public pricing.

Company & contact
Operation profile
Systems & integrations
Needs & scope
Features of interest

CONTACT FECT

Talk to Funk Engineering

Tell us what you want to improve. We will connect you with the right operational expert.

LEGAL

Information